Differentially expressed gene analysis
This tool provides a guideline for differential expression analyses of read counts arising from RNA-Seq using edgeR R package.
Read before use
Users need to prepare two files, gene expression matrix and metadata information.
The gene expression matrix: The first column is Geneid, other columns are data. The name of first column must be Geneid. Data from excel (format: xlsx).
The metadata: The first column is sample names, the second column is treatment conditions, and the third column is group names. Colnames must be Samples, Names, and Groups. Data from excel (format: xlsx).
Note: The order of the sample names in both files must be consistent.
Input example data: Gene expression matrix, Metadata information.

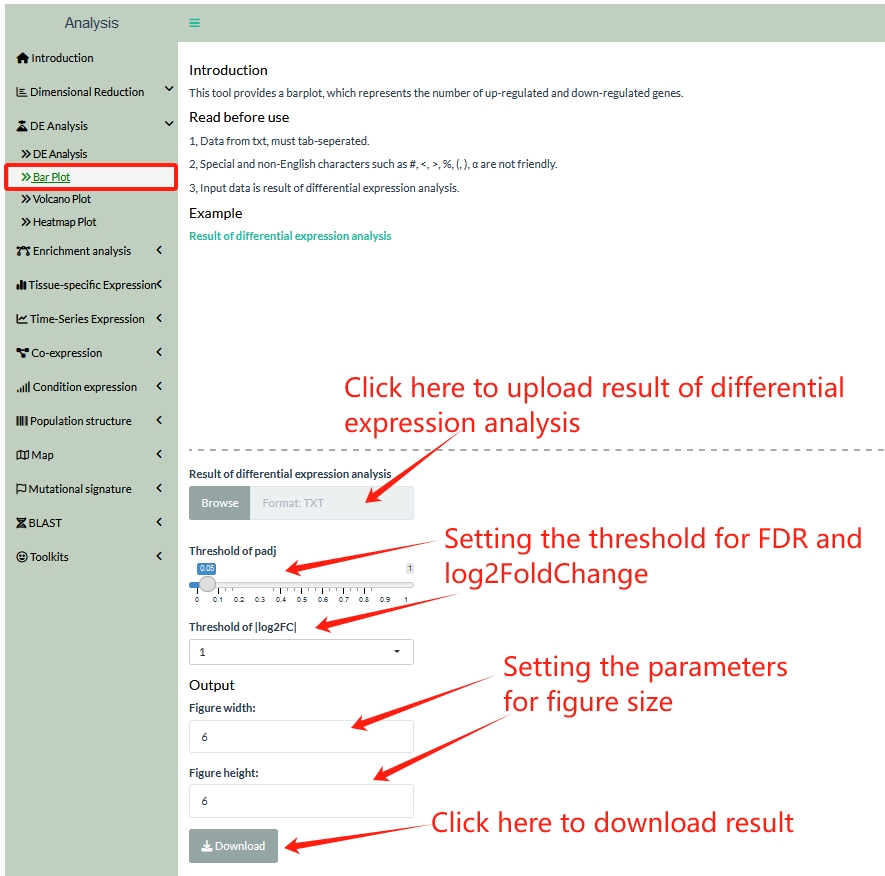
Bar Plot
This tool provides a barplot, which represents the number of up-regulated and down-regulated genes.
Users need to prepare one file, result of differential expression analysis.
Result of differential expression analysis: The first column is Geneid, the second column is log2FoldChange, the third column is pvalue, and fourth column is padj. Data from txt, must tab-seperated (format: txt). Colnames must be Geneid, log2FoldChange, pvalue and padj.
Input example data: Result of differential expression analysis,
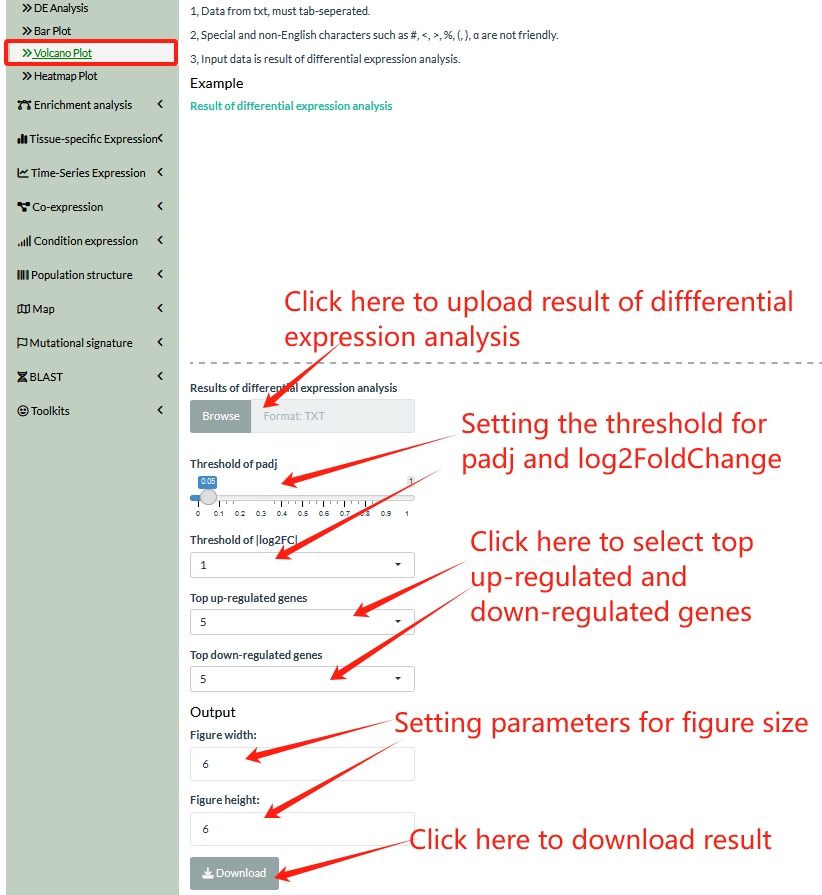
Volcano Plot
This tool provides volcano plot, which is a type of scatterplot that shows statistical significance (P value or adjusted P value) versus magnitude of change (fold change). It enables quick visual identification of genes with large fold changes that are also statistically significant. These may be the most biologically significant genes.
Users need to prepare one file, result of differential expression analysis.
Result of differential expression analysis: The first column is Geneid, the second column is log2FoldChange, the third column is pvalue, and fourth column is padj. Data from txt, must tab-seperated (format: txt). Colnames must be Geneid, log2FoldChange, pvalue and padj.
Input example data: Result of differential expression analysis,
Heatmap Plot
This tool provides a heatmap, which is demonstrated using gene expression data from RNA-Seq. A gene expression heatmap’s visualization features can help a user to immediately make sense of the data by assigning different colors to each gene.
Users need to prepare three files, gene expression matrix, metadata information, and genes list.
The gene expression matrix: The first column is Geneid, other columns are data. The name of first column must be Geneid. Data from excel (format: xlsx).
The metadata: The first column is sample names, the second column is treatment conditions, and the third column is group names. Colnames must be Samples, Names, and Groups. Data from excel (format: xlsx).
The gene list: The first column is Geneid. The name of first column must be Geneid. Data from excel (format: xlsx).
Note: The order of the sample names in both gene expression matrix and metadata information files must be consistent.
Input example data: Gene expression matrix, Metadata information, Gene list.
