Time-Series Expression Analysis
This tool provides a mfuzz plot, which clusters and visualize genes with similar expression patterns, and explores the dynamic changes of different genes over time.
Read before use
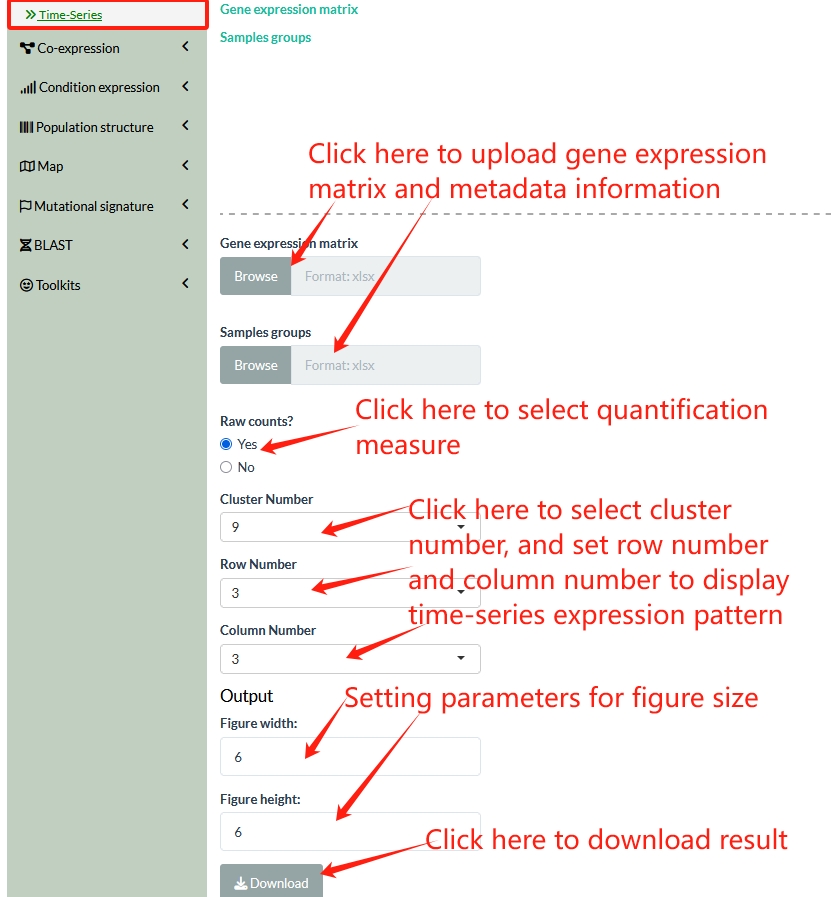
Users need to prepare two files, gene expression matrix and metadata information.
The gene expression matrix: The first column is Geneid, other columns are data. The name of first column must be Geneid. Data from excel (format: xlsx).
The metadata: The first column is sample names, the second column is treatment conditions, and the third column is group names. Colnames must be Samples, Names, and Groups. Data from excel (format: xlsx).
Note: The order of the sample names in both files must be consistent.
Input example data: Gene expression matrix, Metadata information.