Enrichment Analysis
Enrichment analysis is a popular method for analyzing gene sets to interpret gene expression data.
Read before use
Users need to prepare one files, a list of genes of interest.
The gene list: The first column is Geneid. The name of first column must be Geneid. Data from excel (format: xlsx).
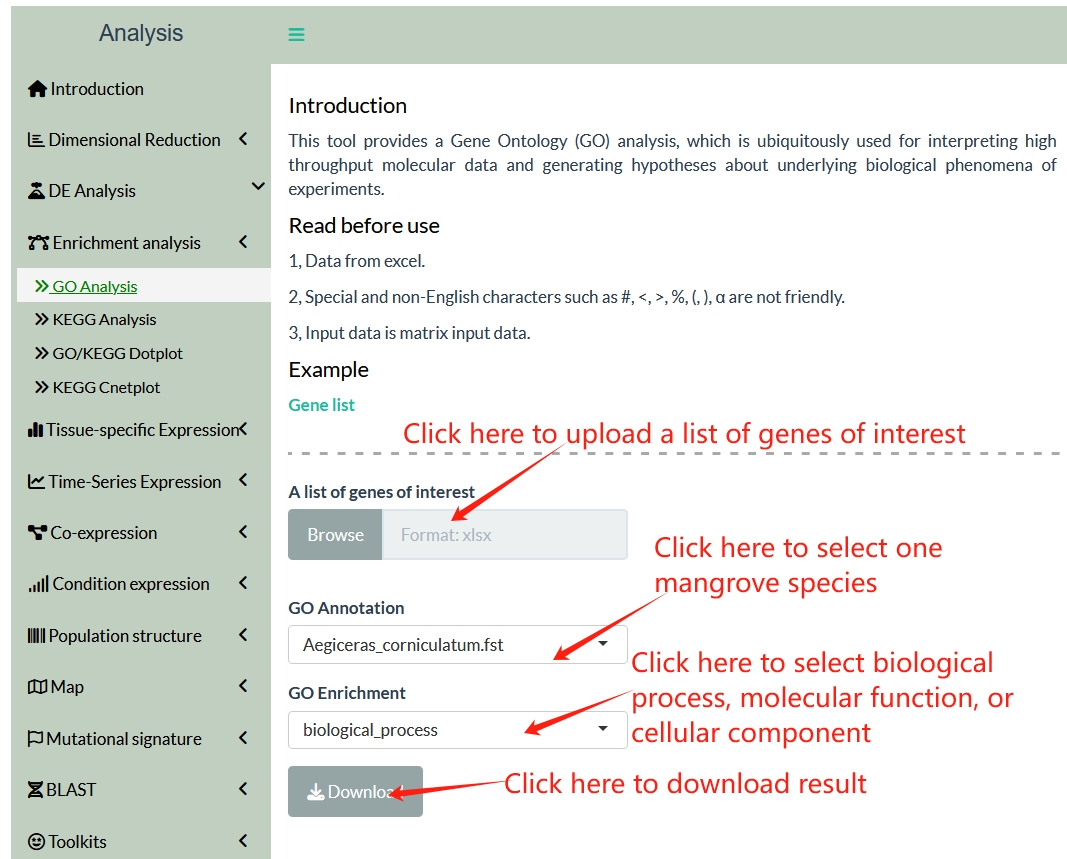
GO Analysis
This tool provides a Gene Ontology (GO) analysis, which is ubiquitously used for interpreting high throughput molecular data and generating hypotheses about underlying biological phenomena of experiments.
Input example data: Gene list.
KEGG Analysis
This tool provides a KEGG analysis. Pathway enrichment analysis helps researchers gain mechanistic insight into gene lists generated from genome-scale (omics) experiments.
Users need to prepare one files, a list of genes of interest.
The gene list: The first column is Geneid. The name of first column must be Geneid. Data from excel (format: xlsx).
Input example data: Gene list.

GO/KEGG Dotplot
This tool provides dotplot, which is generally used in GO, KEGG pathway enrichment analysis, in which adjusted p values are represented by colors, gene counts are represented by bubble size.
Users need to prepare one files, result of GO/KEGG enrichment analysis.
Result of GO/KEGG enrichment analysis: The data must contain Count, Ratio, padj, Description, level columns. Data from txt (format: txt).
Input example data: Result of GO/KEGG enrichment analysis.

KEGG Cnetplot
This tool provides cnetplot, which depicts the linkages of genes and biological concepts (e.g. GO terms or KEGG pathways) as a network.
Users need to prepare one files, a list of genes of interest.
The gene list: The first column is Geneid. The name of first column must be Geneid. Data from excel (format: xlsx).
Input example data: Gene list.
